16 The Two Development Strategies; “Strategy P” and “Strategy I”
At the end of this chapter, the reader will understand:
Strategy I uses Individual outcomes to obtain Approval I for a smart science-based dose titration algorithm.
That any dose titration algorithm (however complex or simple) to support Approval I still produces tabular output for the benefits and harms that are directly comparable to fixed-dose regimens.
How all stakeholders (regulators, patients, physicians, payers and the drug company) define what endpoints are important, and work with analysts to design the science-based dose titration algorithms.
How Strategy P uses Population outcomes to obtain Approval P for either:
Fixed-Dose: Approve 1-2 doses that are “optimal”.
Hybrid: Approve a dose range, with Personalised Dosing enabled via a simple dose titration algorithm.
That Strategy P only requires a wide range of fixed-dose regimens to be studied throughout the drug development program.
The previous chapters have made the case for approaching drug development based on a fixed-dose strategy based on Population outcomes (herein called Strategy P), and/or a Personalised Dosing strategy based on Individual outcomes (herein called Strategy I). Thus Strategy P uses Population outcomes to obtain Approval P, and Strategy I uses Individual outcomes to obtain Approval I.
Now we will discuss, from a non-technical perspective, how both strategies can be implemented, but first we will discuss some of the similarities between the two strategies.
I think the concept of Personalised Dosing based on a dose titration algorithm leads to anxiety/fear from some stakeholders that the data generated will not be easy for them to understand, and hence such drug development strategies should be avoided. This is misguided.
In addition, many people in clinical drug development and regulatory groups may only have experience with clinical trials using fixed-dose regimens. For example they may ask, how can one easily see the dose-response, if patients are being titrated to different doses based on measures of efficacy and safety? Indeed, even in a leading journal in clinical pharmacology, Clinical Pharmacology and Therapeutics (CPT), a paper was published in 2021 entitled “The Drug Titration Paradox: Correlation of More Drug With Less Effect in Clinical Data” [1], where the first line of the abstract read:
“While analysing clinical data where an anaesthetic was titrated based on an objective measure of drug effect, we observed paradoxically that greater effect was associated with lesser dose”
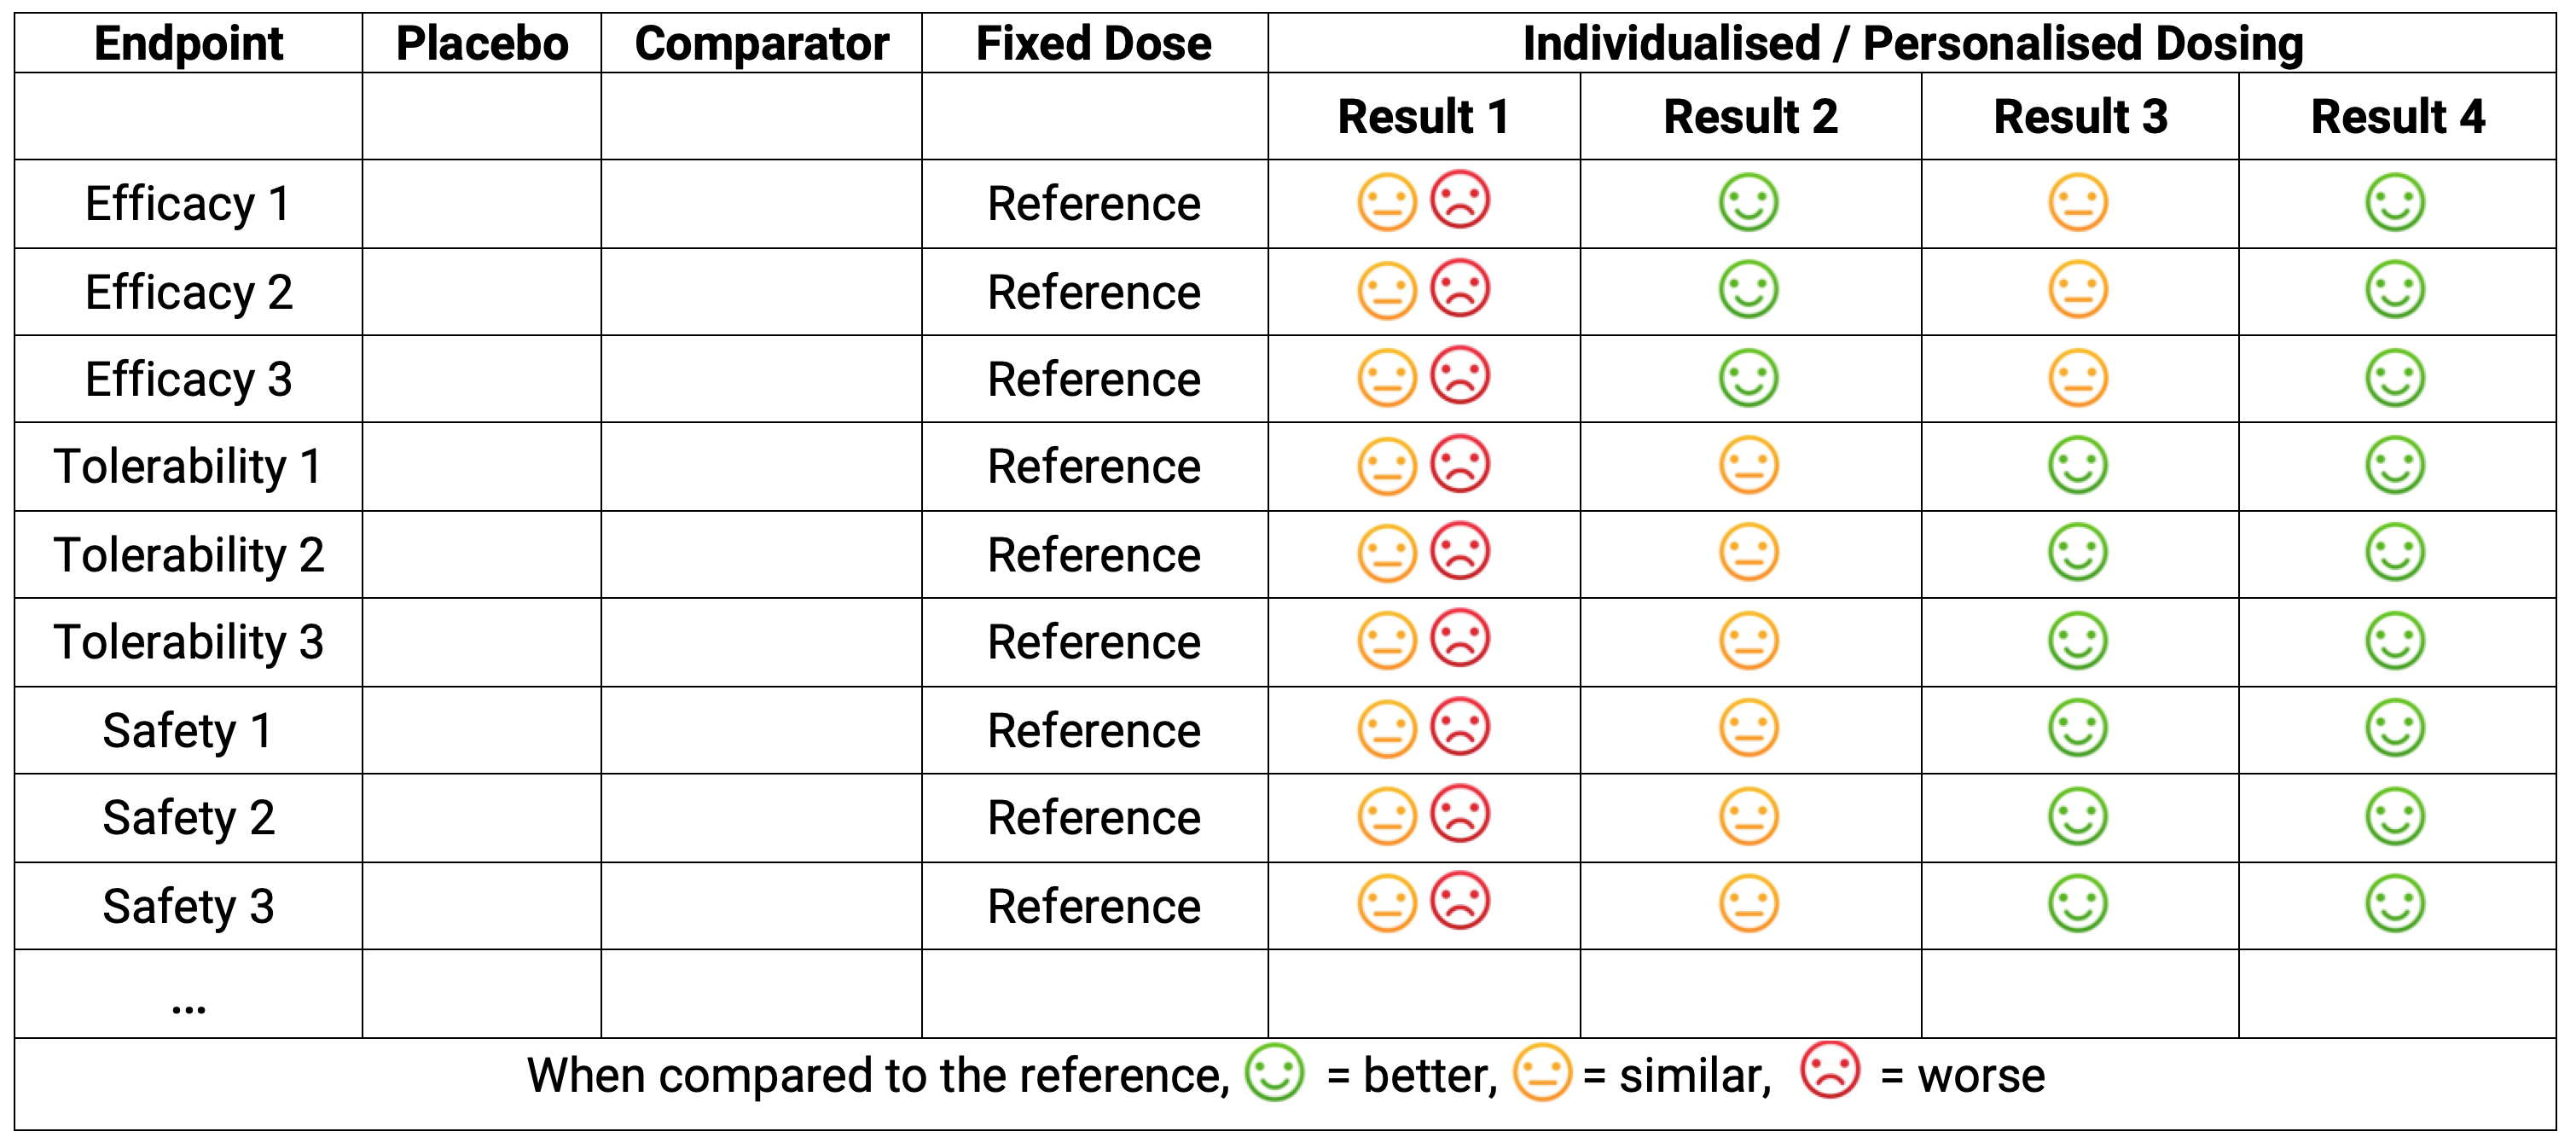
Astonishingly, the authors (and the editors!?) considered this a paradox (a logically self-contradictory statement or a statement that runs contrary to one’s expectation). Their observation was that, during the maintenance phase of anaesthesia, lower doses of propofol were associated with greater effects on the brain (as measured by the Bispectral Index). The simple analysis employed focussed only on the maintenance dose for each individual, and ignored the within individual titration that would have occurred previously. It is perfectly normal to expect that response-guided titrations will generally lead to a flat dose-response if only the final dose is used; it is also not remarkable that a modestly positive or negative dose-response relationship is observed (as observed by these authors), but any such simple analysis is wholly unreliable and meaningless. The publication of this article shows that there remains confusion over dose-response relationships with response-guided dose titration data even within clinical pharmacology circles. Fortunately I recently reviewed another CPT paper that showed an appropriate analysis could avoid such a “paradox!” [2] in case anyone wasn’t sure it was possible! Thus for any response-guided dose titration, we cannot just create summary tables by final dose, as these will clearly be wrong, since only some (non-random) sample of patients will be titrated to the higher doses. In contrast, fixed-dose strategies are very easy to understand; unfortunately these are invariably not best for patients, so when we remember that we must put patient outcomes first, we cannot be lazy and, a priori, reject the potentially enormous benefits for patients with individualised dosing. At the highest level, we can think of the results of any individualised dosing strategy at the summary table level, without any regard to the actual dose titration algorithm used. For example, in Figure 16.1 below we combine the general tabular results from a typical drug development program with 4 hypothetical results we might achieve with individualised dosing. The table shows 9 endpoints (3 efficacy, 3 tolerability, and 3 safety) and how well or poorly the individualised dosing algorithm might work relative to the (reference) fixed-dose regimen.

Strategy P may look like columns 1-4 in the above.
Strategy I may yield Result 1; dose individualisation has not yielded any improvement relative to the fixed-dose strategy. In this case, either the titration algorithm was poor, or the drug is less amenable to dose individualisation, or both.
Strategy I may yield Result 2; dose individualisation has yielded an improvement in efficacy relative to the fixed-dose strategy, but at no cost in terms of safety/tolerability.
Strategy I may yield Result 3; dose individualisation has yielded an improvement in safety/tolerability relative to the fixed-dose strategy, but at no cost in terms of efficacy.
Strategy I may yield Result 4; dose individualisation has yielded an improvement in both efficacy and safety/tolerability relative to the fixed-dose strategy.
Except for our rare “diamond” drugs like sitagliptin, I would consider Result 1 very unlikely. Result 2 and 3 could come from the same drug, where the dose escalation and dose range was more aggressive/efficacy focussed (Result 2) or more cautious/safety focussed (Result 3). Result 4 is the best outcome, where through dose individualisation we have achieved improvements in both efficacy and safety relative to fixed dosing. Note Result 4 is what always happens with anaesthetic agents, warfarin, basal insulins, alcohol etc. (I might ask “Why would this not be true for drugs in your therapeutic area?”).
In the above tabular output, the actual dose titration algorithm used is unseen. From a reviewer’s perspective, how the better outcomes were achieved does not even need to be fully understood. To illustration this point, there are many aspects of drug development I do not understand, for example the manufacturing processes of monoclonal antibodies. I just know the right people are skilled to ensure their final product, the drug dose of the monoclonal antibody, is correct. Thus when we review the table, we just need to know the right people worked to achieve the best science based dose-titration algorithm. Thus I hope this may help to allay any anxiety/fear with Personalised Dosing; we just get additional columns with, we may expect, better outcomes for patients (and that is what we really care about!).
Clearly to effectively design science-based dose titration algorithms, we need multiple stakeholders to work together:
Regulators, patients, physicians, payers and the drug company to define what PD endpoints for efficacy and safety/tolerability are most important.
Analysts to propose dose titration algorithms based on measurable endpoints, including surrogate endpoints, biomarkers, imaging data, PROs, drug concentrations and safety/tolerability endpoints. These must be transferable to routine clinical practice.
As an (old!) analyst, I am sure that proposing dose titration algorithms in all therapeutic areas will be possible. In some therapeutic areas it will be very straightforward, with easily measured endpoints being highly predictive/correlated with later outcomes, whilst other areas may require more invasive and/or costly measures (e.g. tumour biopsies, scans) and/or repeated observations due to inherently variable measures. As Lewis Sheiner said “We always know something”.
In my world, it would be perfectly judicious to study multiple titration algorithms, for example a “Simple goal” algorithm that is lightweight and easy to use (e.g. using simple endpoints such as patient/physician global assessments after each month). Alternatives could include more complex dose-titration algorithms using multiple assessments (e.g. changes in neutrophils, changes in tumour size etc.), and could be labelled such as “Efficacy goal”, where the goal is to focus on getting patients quickly towards their personal MTDi, or “Safety goal”, where a less aggressive, more patient friendly, dosing algorithm is used. Would it not be fantastic to see such trials, allowing us to meaningfully weight up different algorithms in terms of the outcomes they achieved versus their easy of use in clinical practice? Would this not lead to the best dose titration algorithms for all patients going forward? I think so, and hope you would agree.
To summarise, Strategy I will require the development of science-based dose titration algorithms that are focussed on key efficacy and/or safety/tolerability endpoints relevant to the drug and therapeutic area. However the outcomes achieved with these personalised dosing algorithms can be easily compared with those achieved with the simpler fixed-dose regimens. Drug Development For Patients needs these trials.
For Strategy P, the drug development steps are simpler; we need to study a wide range of doses throughout the drug development program. The following is largely based on the text from a paper I wrote in CPT [3] that introduced Strategy P. This was my attempt to “update” the seminal Learn-Confirm paper by Sheiner [4], where he highlighted the critical role of “learning” in drug development. He commented:
“. . .the intellectual focus for clinical drug development should be on understanding (i.e., science and learning).”
In the 25 years since he wrote this paper, the importance of quantifying and predicting the safety/tolerability of different dosing regimens (in addition to efficacy) has become a central component in the evaluation of any new drug. Sheiner did recognize the importance of being able to estimate how safety endpoints change as a function of drug exposure and patient covariates. He wrote:
“In confirmatory trials...a larger number of toxicity outcomes may be observed, but this is because the analysis of a confirmatory trial for toxicity is actually a learning analysis”.
The sentiment here is that the “learning” about safety/tolerability is only occurring at the end of the confirmative trials for efficacy (i.e. at the end of phase 3), where only 1-2 dose may have been investigated. Today, our trials need to put efficacy and safety/tolerability on an equal footing; we must plan to learn about safety/tolerability using our late phase clinical trials in the same way as we plan to learn about efficacy. The same logic (i.e., “science and learning”) that applied to efficacy endpoints in 1997 must apply equally, if not even more importantly, to safety/tolerability endpoints today. We must therefore design our trials to “learn” how safety/tolerability endpoints change as a function of dose (just like we do with efficacy). D-E-R analyses for safety/tolerability should never be an “afterthought”.
When we employ Strategy P, the paradigm is one of quantifying D-E-R relationships across both efficacy and safety/tolerability endpoints. Thus the design that we want will cover the right dose range and have the best dose levels when we want to accurately and precisely quantify both efficacy and safety/tolerability endpoints. This may seem very ambitious, since there are hundreds of potential safety/tolerability endpoints, so how can we design a trial that is “optimal” for all? This is less daunting than it may first appear. The “trick” is to understand that the D-E-R relationships for safety/tolerability will be located either in a similar location to, or to the left of, the D-E-R relationships for efficacy. That is, if the ED50 for efficacy is 10 mg, the ED50 for tolerability/safety endpoint will generally be similar to or lower than 10 mg. In the later chapter on the design of Population D-E-R, we will cover this in much more detail, but the principle here is that we need to think about the precision of the D-E-R for safety/tolerability when designing these trials.
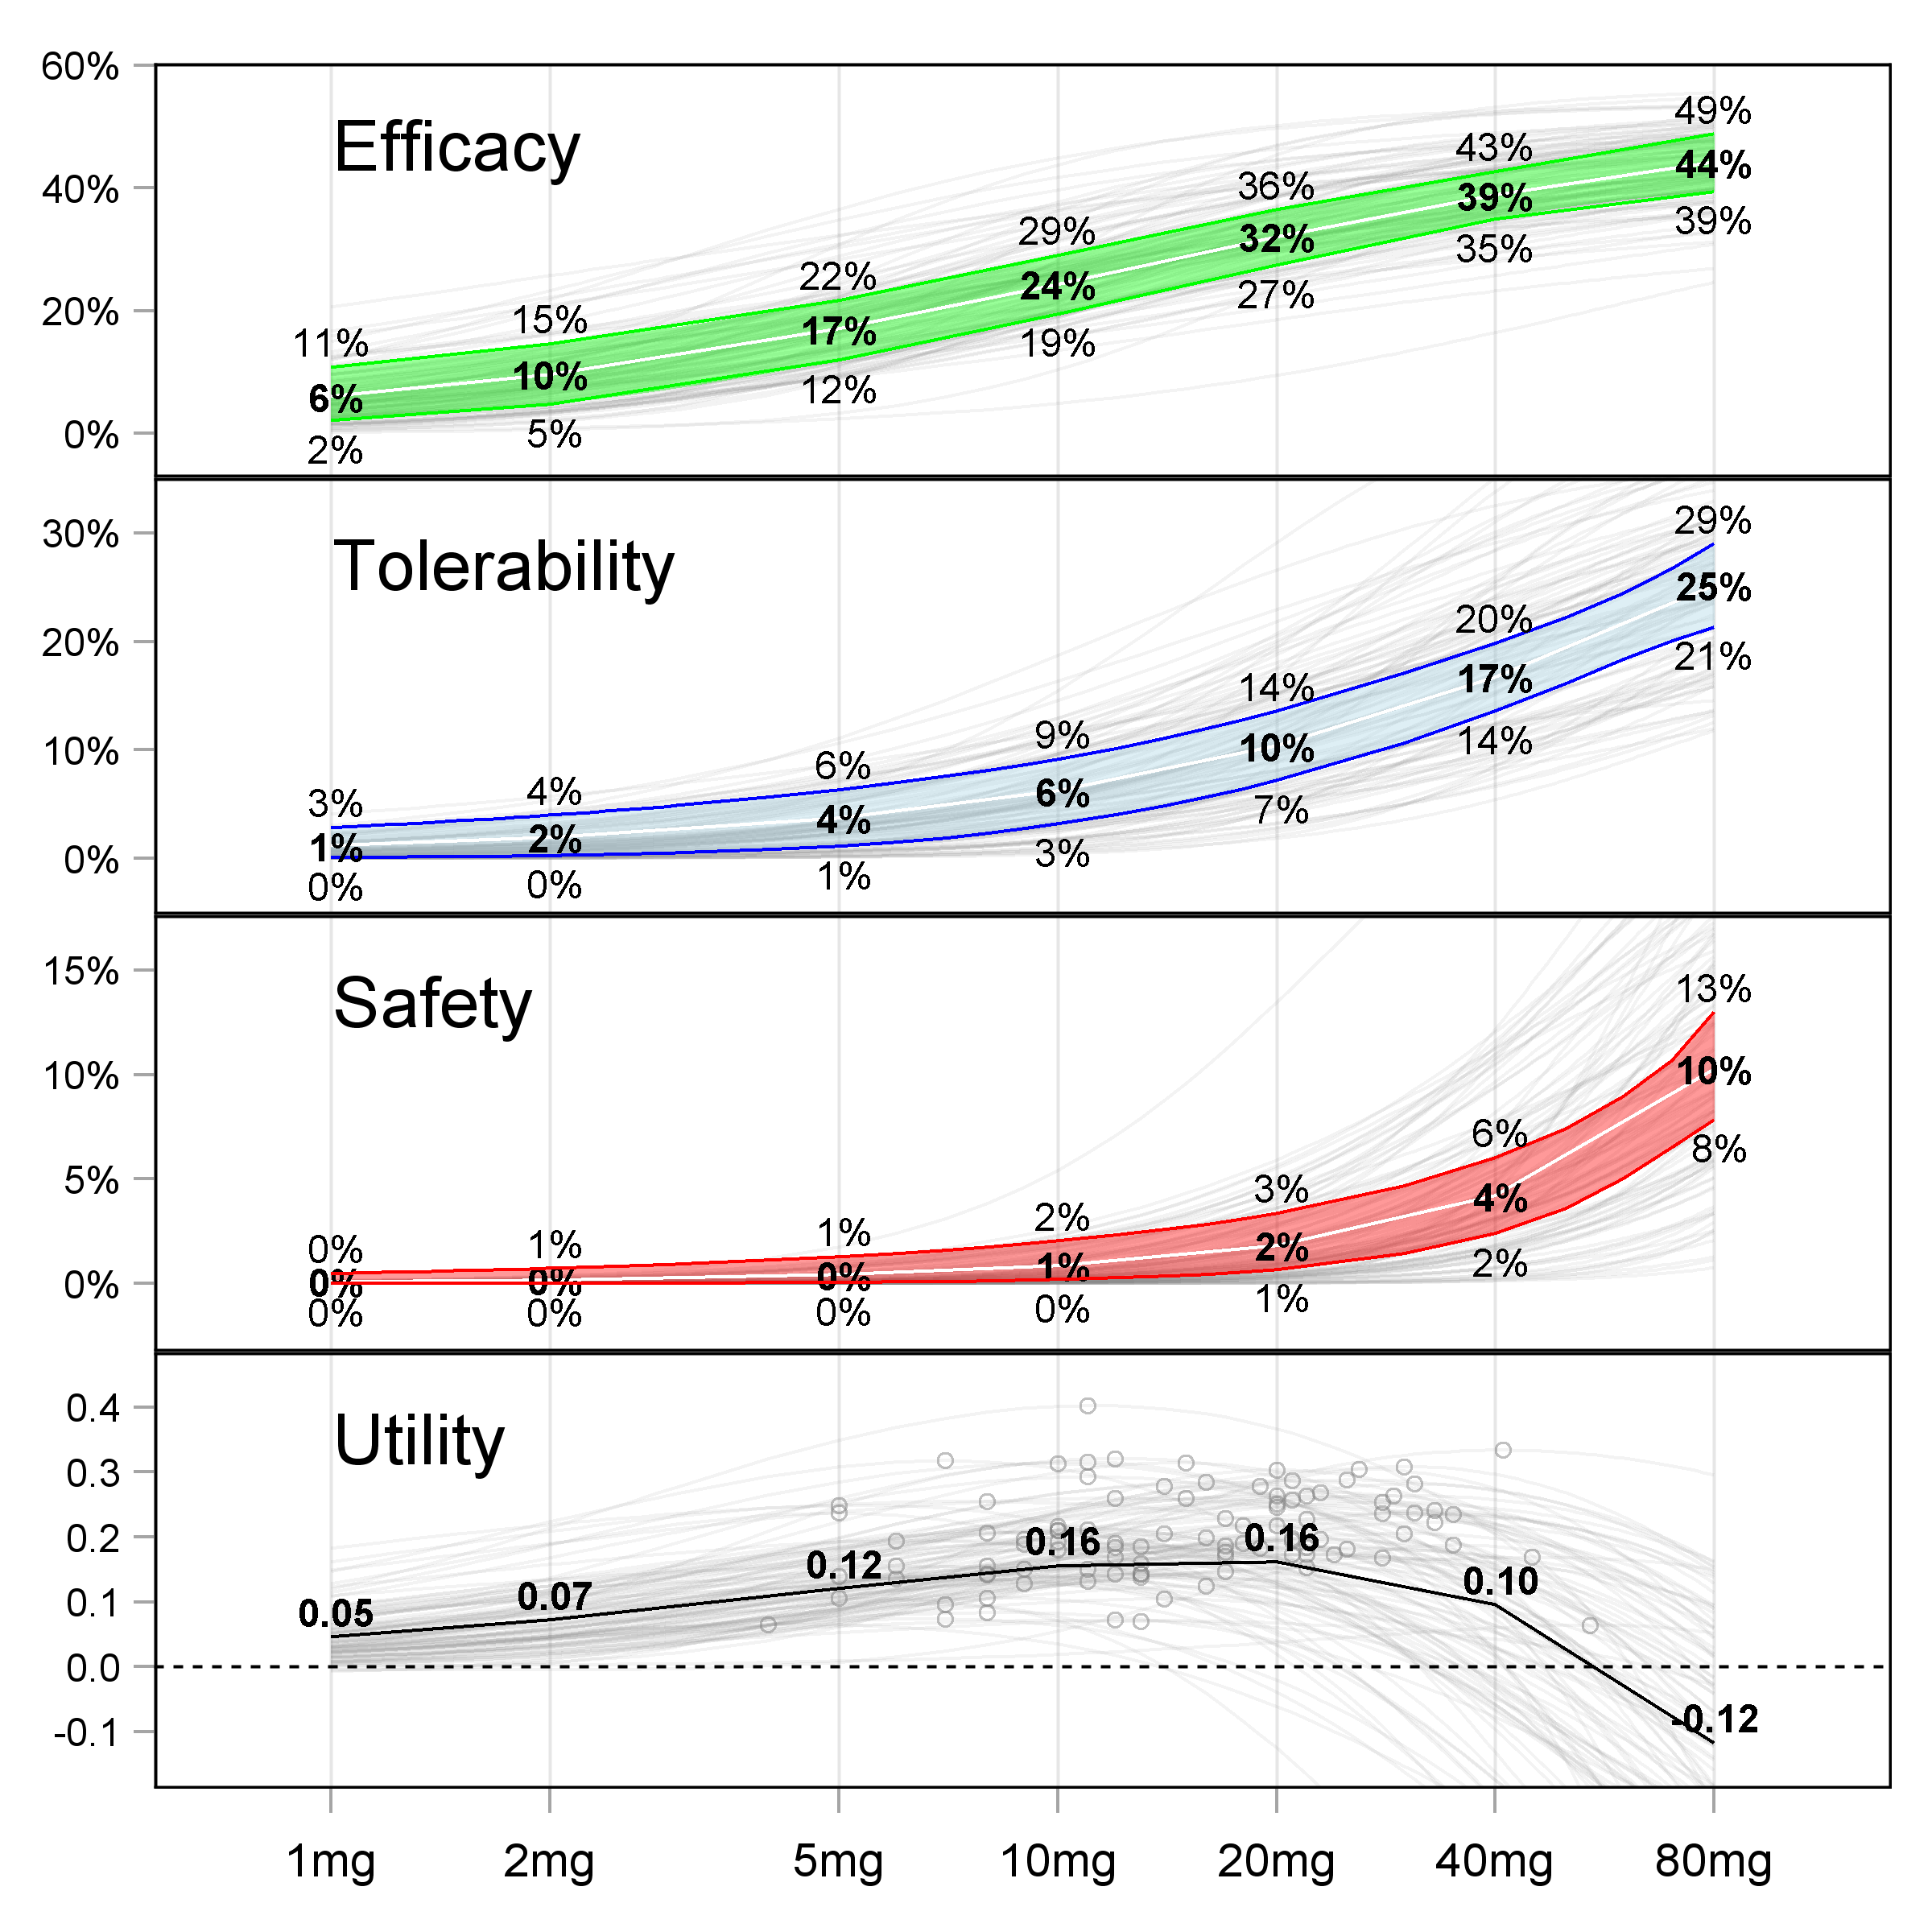
The end result of Strategy P will be a set of D-E-R relationships across all efficacy and safety/tolerability endpoints. An example across 3 endpoints is shown below in Figure 16.2.

When reviewing such D-E-R relationships, it is clear we are “trading-off” the increasing benefits with higher doses with the increasing risks with higher doses. As a drug company or regulator, we have the full picture of what our drug is doing, and can therefore make informed decisions around what dose(s) to approve. The beauty of the above results is that the drug company has not had to “guess” the magic phase 3 dose(s) based on pitifully small phase 2 trials (recall how most phase 2 trials are not even precisely quantifying the D-E-R for efficacy, let alone for safety/tolerability). Here there is clarity because of the wide dose range and sufficiently large sample size.
Strategy P comes with two dose range approval options.
Fixed-Dose: Approve 1-2 doses that (at the population level) are “optimal”
Hybrid: Approve a dose range, with personalised dosing enabled via a simple dose titration algorithm.
Option Fixed-Dose is the best “one-size-fits-all” dosing strategy. That is, if we must pick just 1 or 2 fixed-dose regimens (with no option to titrate), then these will be our best dose regimens. In the above example, this could be 10 mg and 20 mg, since arguably they represent the fixed-dose regimens with the best benefit-risk profiles.
An alternative to just picking 1-2 fixed-dose regimens is option Hybrid. Here we are enabling personalised dosing by supporting a wide dose range, but one based on only the population D-E-R relationships (i.e. a hybrid between individual and population strategies). In the above example, this could be to approve the range 2.5 mg, 5 mg, 10 mg, 20 mg and 40 mg. Here we are implicitly recognising that the “one-size-fits-all” doses are going to be too high or too low for some patients, because we understand that there are individual D-E-R relationships “behind” these population D-E-R relationships (the gray lines in the figures). For example, in RA or epilepsy, the patient could start on the 2.5 mg for the first month, before moving to 5 mg / 10 mg / 20 mg / 40 mg in months 2 / 3 / 4 / 5 respectively if required.
Compared to Fixed-Dose, the Hybrid approach is most consistency with the “do no harm” principle.
If we push all patients directly onto 10 mg from day 1, there will be patients who are particular sensitivity to the drug (low individual ED50s for efficacy and tolerability/safety) and/or with higher than average drug concentrations relative to the average patient (low individual clearances). For example, one of these patients may experience a moderate or severe adverse event at 10 mg. If this patient had started at 2.5 mg, the intensity/severity of the adverse event would be much lower (or they may not experience the adverse event at all). Indeed, this patient may be perfectly well treated at 2.5 mg and hence not need to titrate to a higher dose. Thus Hybrid will reduce the incidence, frequency and severity of adverse events, and allow patients to find “their” dose across the dose range. The only limitation of Hybrid is that it will take a little longer for the least sensitive patients to find their dose as they titrated from the lower doses to the higher doses.
The Hybrid option may initially seem more onerous, requiring physicians and patients to meet regularly after each dose level to decide whether to increase/maintain/decrease the patients dose level. However this could be achieved quite simply. For example, under the Fixed-Dose option, the patient may be sent home with a box containing a 3-month supply of 10 mg, will the advice to call if they experience any adverse events during this time. Under the Hybrid option, they could be sent home with a box containing the month 1 supply of 2.5 mg, the month 2 supply of 5 mg and the month 3 supply of 10 mg, will the same advice to call if they experience any adverse events during this time. Unless the 10 mg dose has an excellent safety profile (like sitagliptin 100 mg) I see the latter as most coherent with the important “do no harm” mantra. Most drugs do not have an excellent safety profile, and hence why the Hybrid approach is appealing.
In the discussion above, the simple titration algorithm was to increase the dose at monthly intervals. Clearly the timeframe for the dose titrations under the Hybrid option would be based on knowledge of the magnitude and temporal changes in both the PK and PD effects, and hence could be short or longer than at monthly intervals. This would naturally be balanced against the need to find the right dose for each patient as quickly as possible.
This chapter has outlined the following approaches to drug development and approval:
Strategy I uses Individual outcomes to obtain Approval I for the optimal science-based dose titration algorithm.
Strategy P uses Population outcomes to obtain Approval P for either:
Fixed-Dose: Approve 1-2 doses that are “optimal”.
Hybrid: Approve a dose range, with personalised dosing enabled via a simple dose titration algorithm.
From a trial design perspective, both Strategy P approaches require the same trial designs, thus their difference is in how all stakeholders (regulators, patient/physicians, drug companies etc.) decide whether the Fixed-Dose or Hybrid will ultimately serve patients/physicians best. Although the drug company may see the need to support multiple dose strengths as an additional burden, I would encourage them to see this as a small price to pay to enable each patient to find the right dose for them, and hence happily stay (and pay) for the drug going forward (recall lower “churn” = greater revenue).
In later chapters we will discuss in more technical details about the design and analysis of the D-E-R trials needed to support both Strategy P and Strategy I.
