13 Population and Individual Dose-Exposure-Responses, Therapeutic Windows and Maximum Tolerated Doses
At the end of this chapter, the reader will understand:
That we need precise language when we discuss D-E-R, therapeutic windows and maximum tolerated doses; Population and Individual levels are very different.
That knowing the shape of the Population D-E-R does not tell us about the shape of Individual D-E-R relationships.
Why Individual optimal doses will be markedly different to any Population optimal dose; no one dose is optimal.
Extensive experiences with anaesthetic agents, warfarin and insulin show us that to achieve the same response, the optimal doses for patients span very wide dose ranges (think 10-50 fold).
It is common to hear discussions on the “dose response” of a drug, but to truly understand and communicate what we mean by this term, we need to be much more exact in our language. This is because Personalised Dosing requires us to think and understand “dose response” at the Individual level, not the Population level.
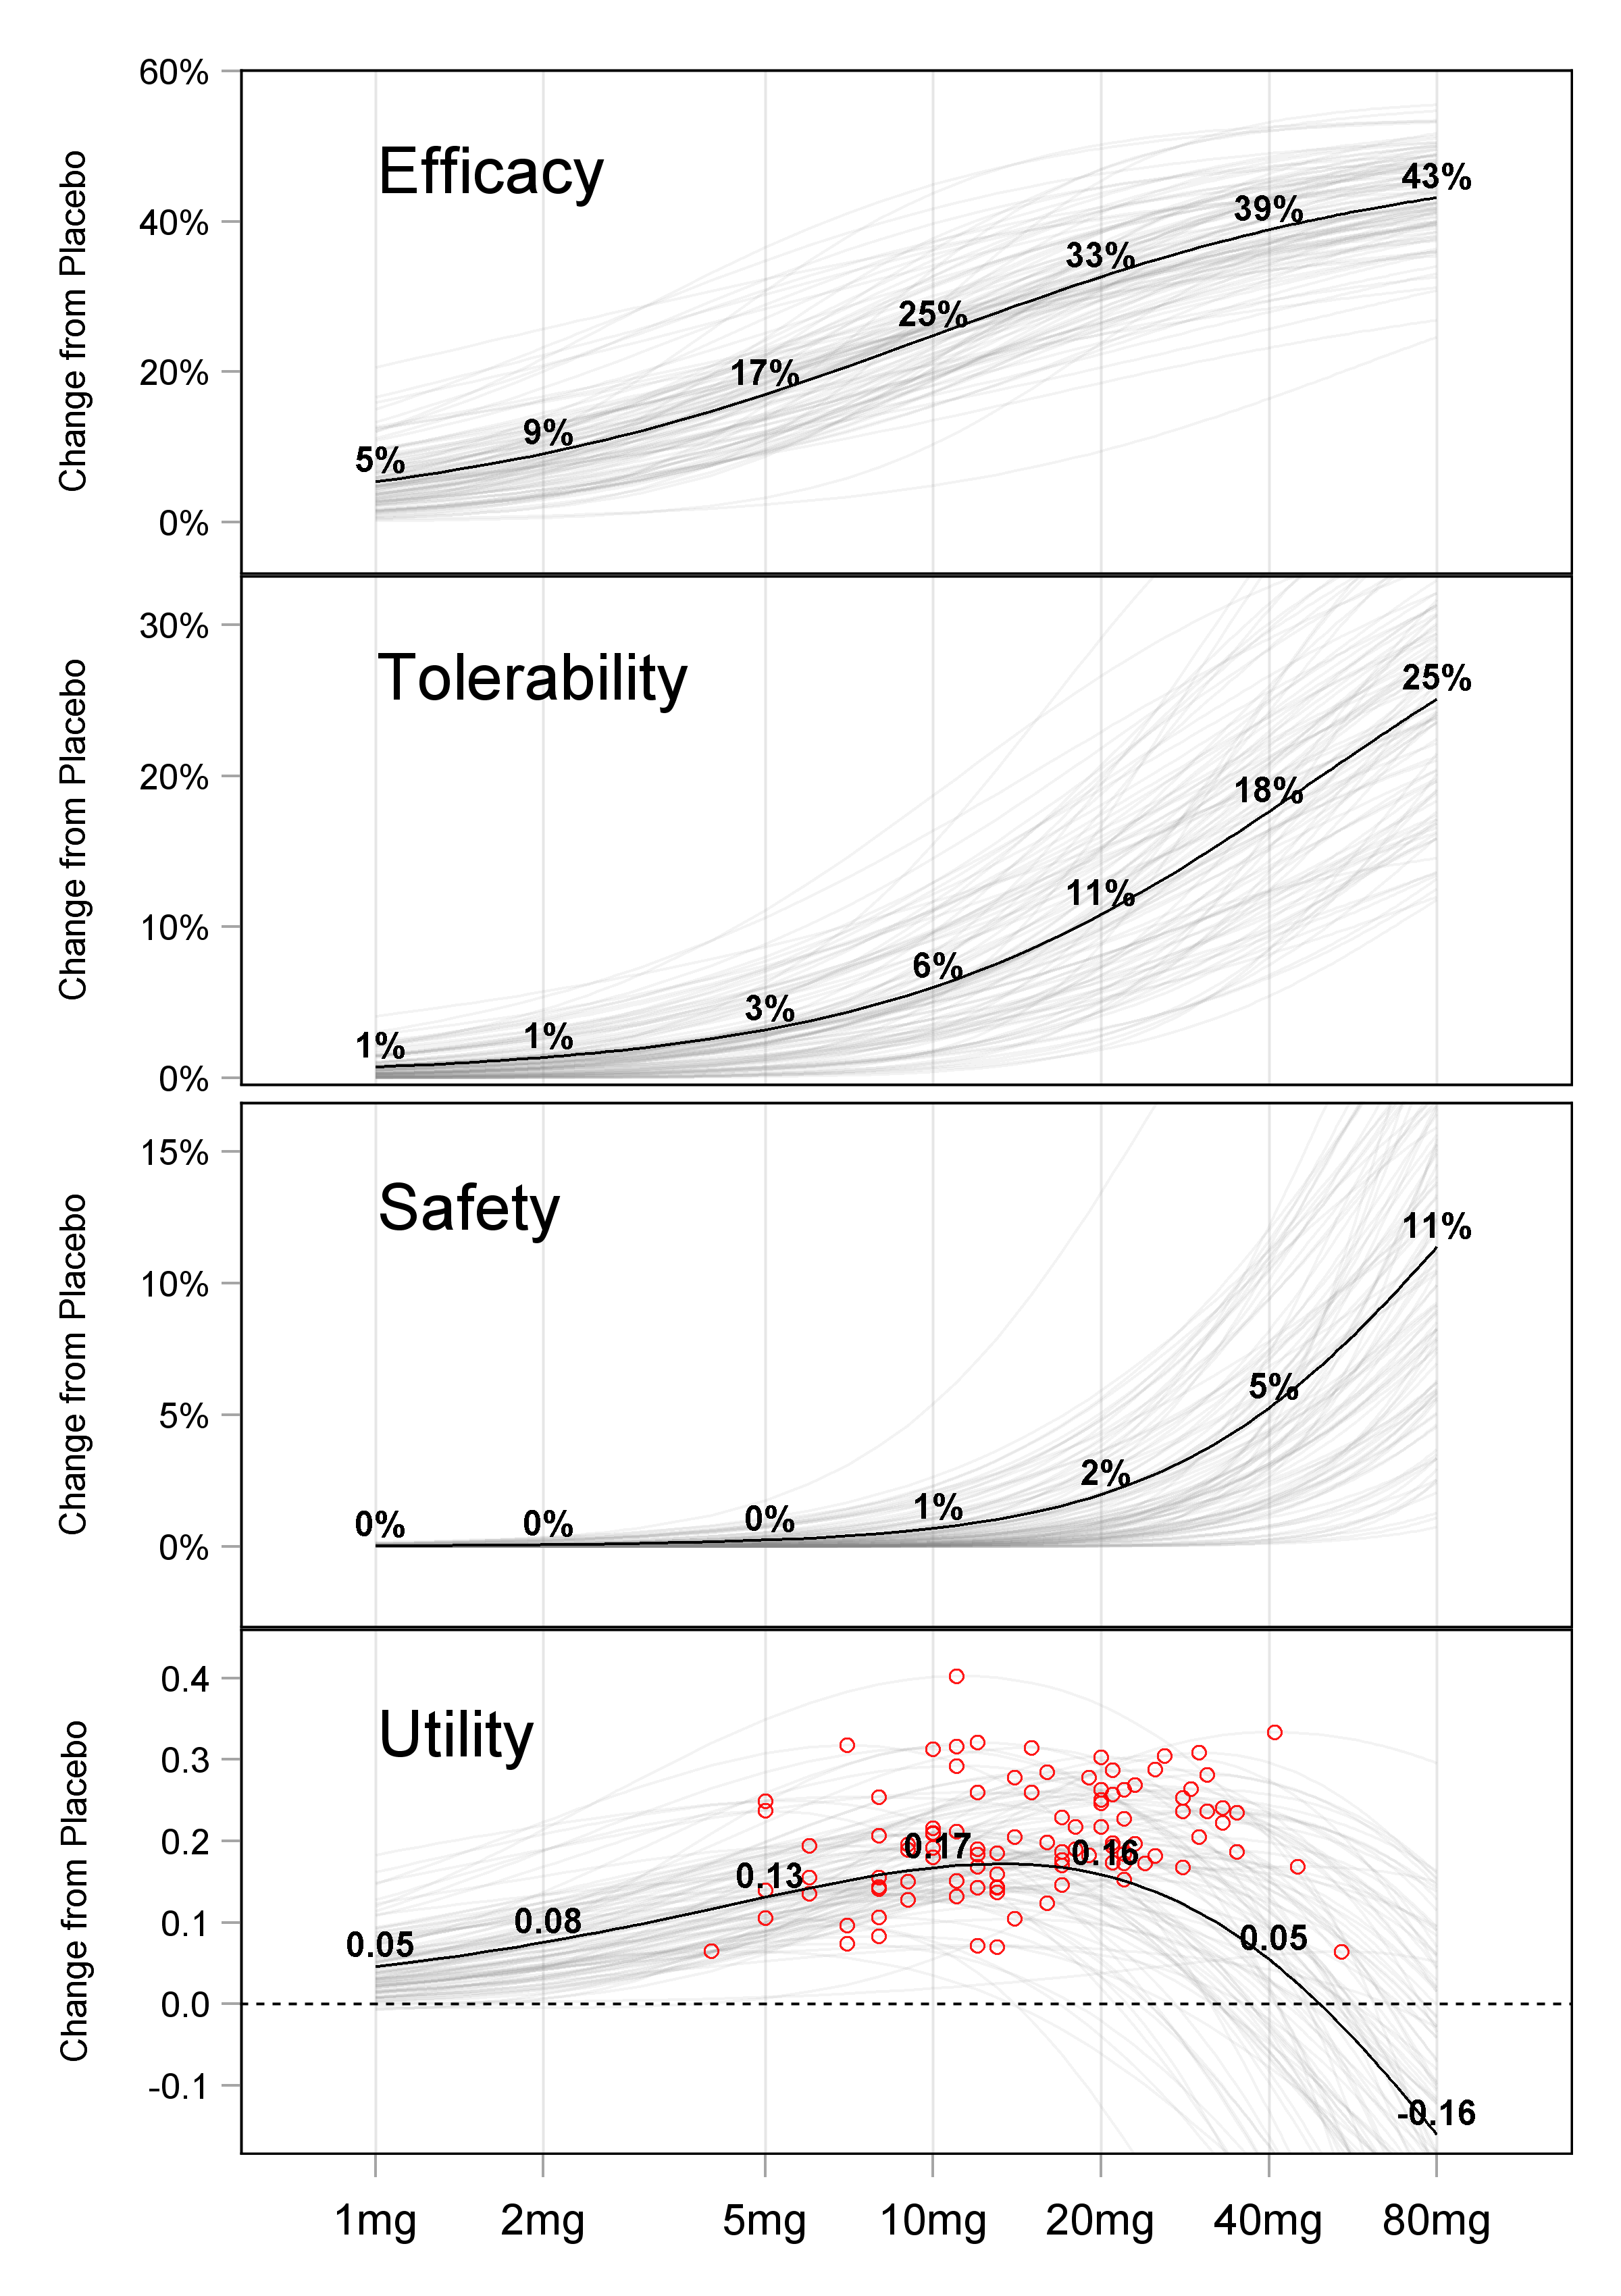
Fundamentally, when we discuss the D-E-R relationship, a key distinction needs to be made between the Population D-E-R relationship and Individual D-E-R relationships. Figure 13.1 shows the relationship between the Population D-E-R and Individual D-E-R relationships for a hypothetical drug (for simplicity, just the D-R is shown). The efficacy, tolerability and safety responses are plotted versus dose for 100 individuals (the gray lines); importantly, Individuals do not all have the same D-R, but have their own D-R (this is the IIV in D-R discussed previously). The final panel of the figure shows a simple clinical utility index (CUI) that balances the “benefits” in efficacy with increasing dose with the “harms” in terms of tolerability/safety with increasing dose.

The Population D-R (the bold line in the figure above) simply joins together the average of the individual responses for each dose. Since the individual D-R relationships with dose are non-linear, the Population D-R is not even the dose response for a “typical” individual; individuals can have very different individual D-R relationships compared to the Population D-R. Thus an increase in dose at the individual level will not “move patients along” the Population D-R curve, rather it will move them along their curve.
The Population D-R relationship does not tell us anything about the underlying D-R relationships for individual patients.
In contrast, the individual D-R relationships (shown in gray) are exactly what we seek to understand, and hence determine the optimal dose for each individual (and indeed the optimal dose titration algorithm). The final panel of the figure, labelled Utility, highlights with red circles the dose for each individual that maximises their individual utility (i.e. the best dose for each individual based on a simple CUI). Note how the Population utility curve has a maximum at 10 mg, but that the individual “optimal” doses in this simple example range from below 5 mg to greater than 40 mg, spanning more than a 10-fold range across the 100 individuals.
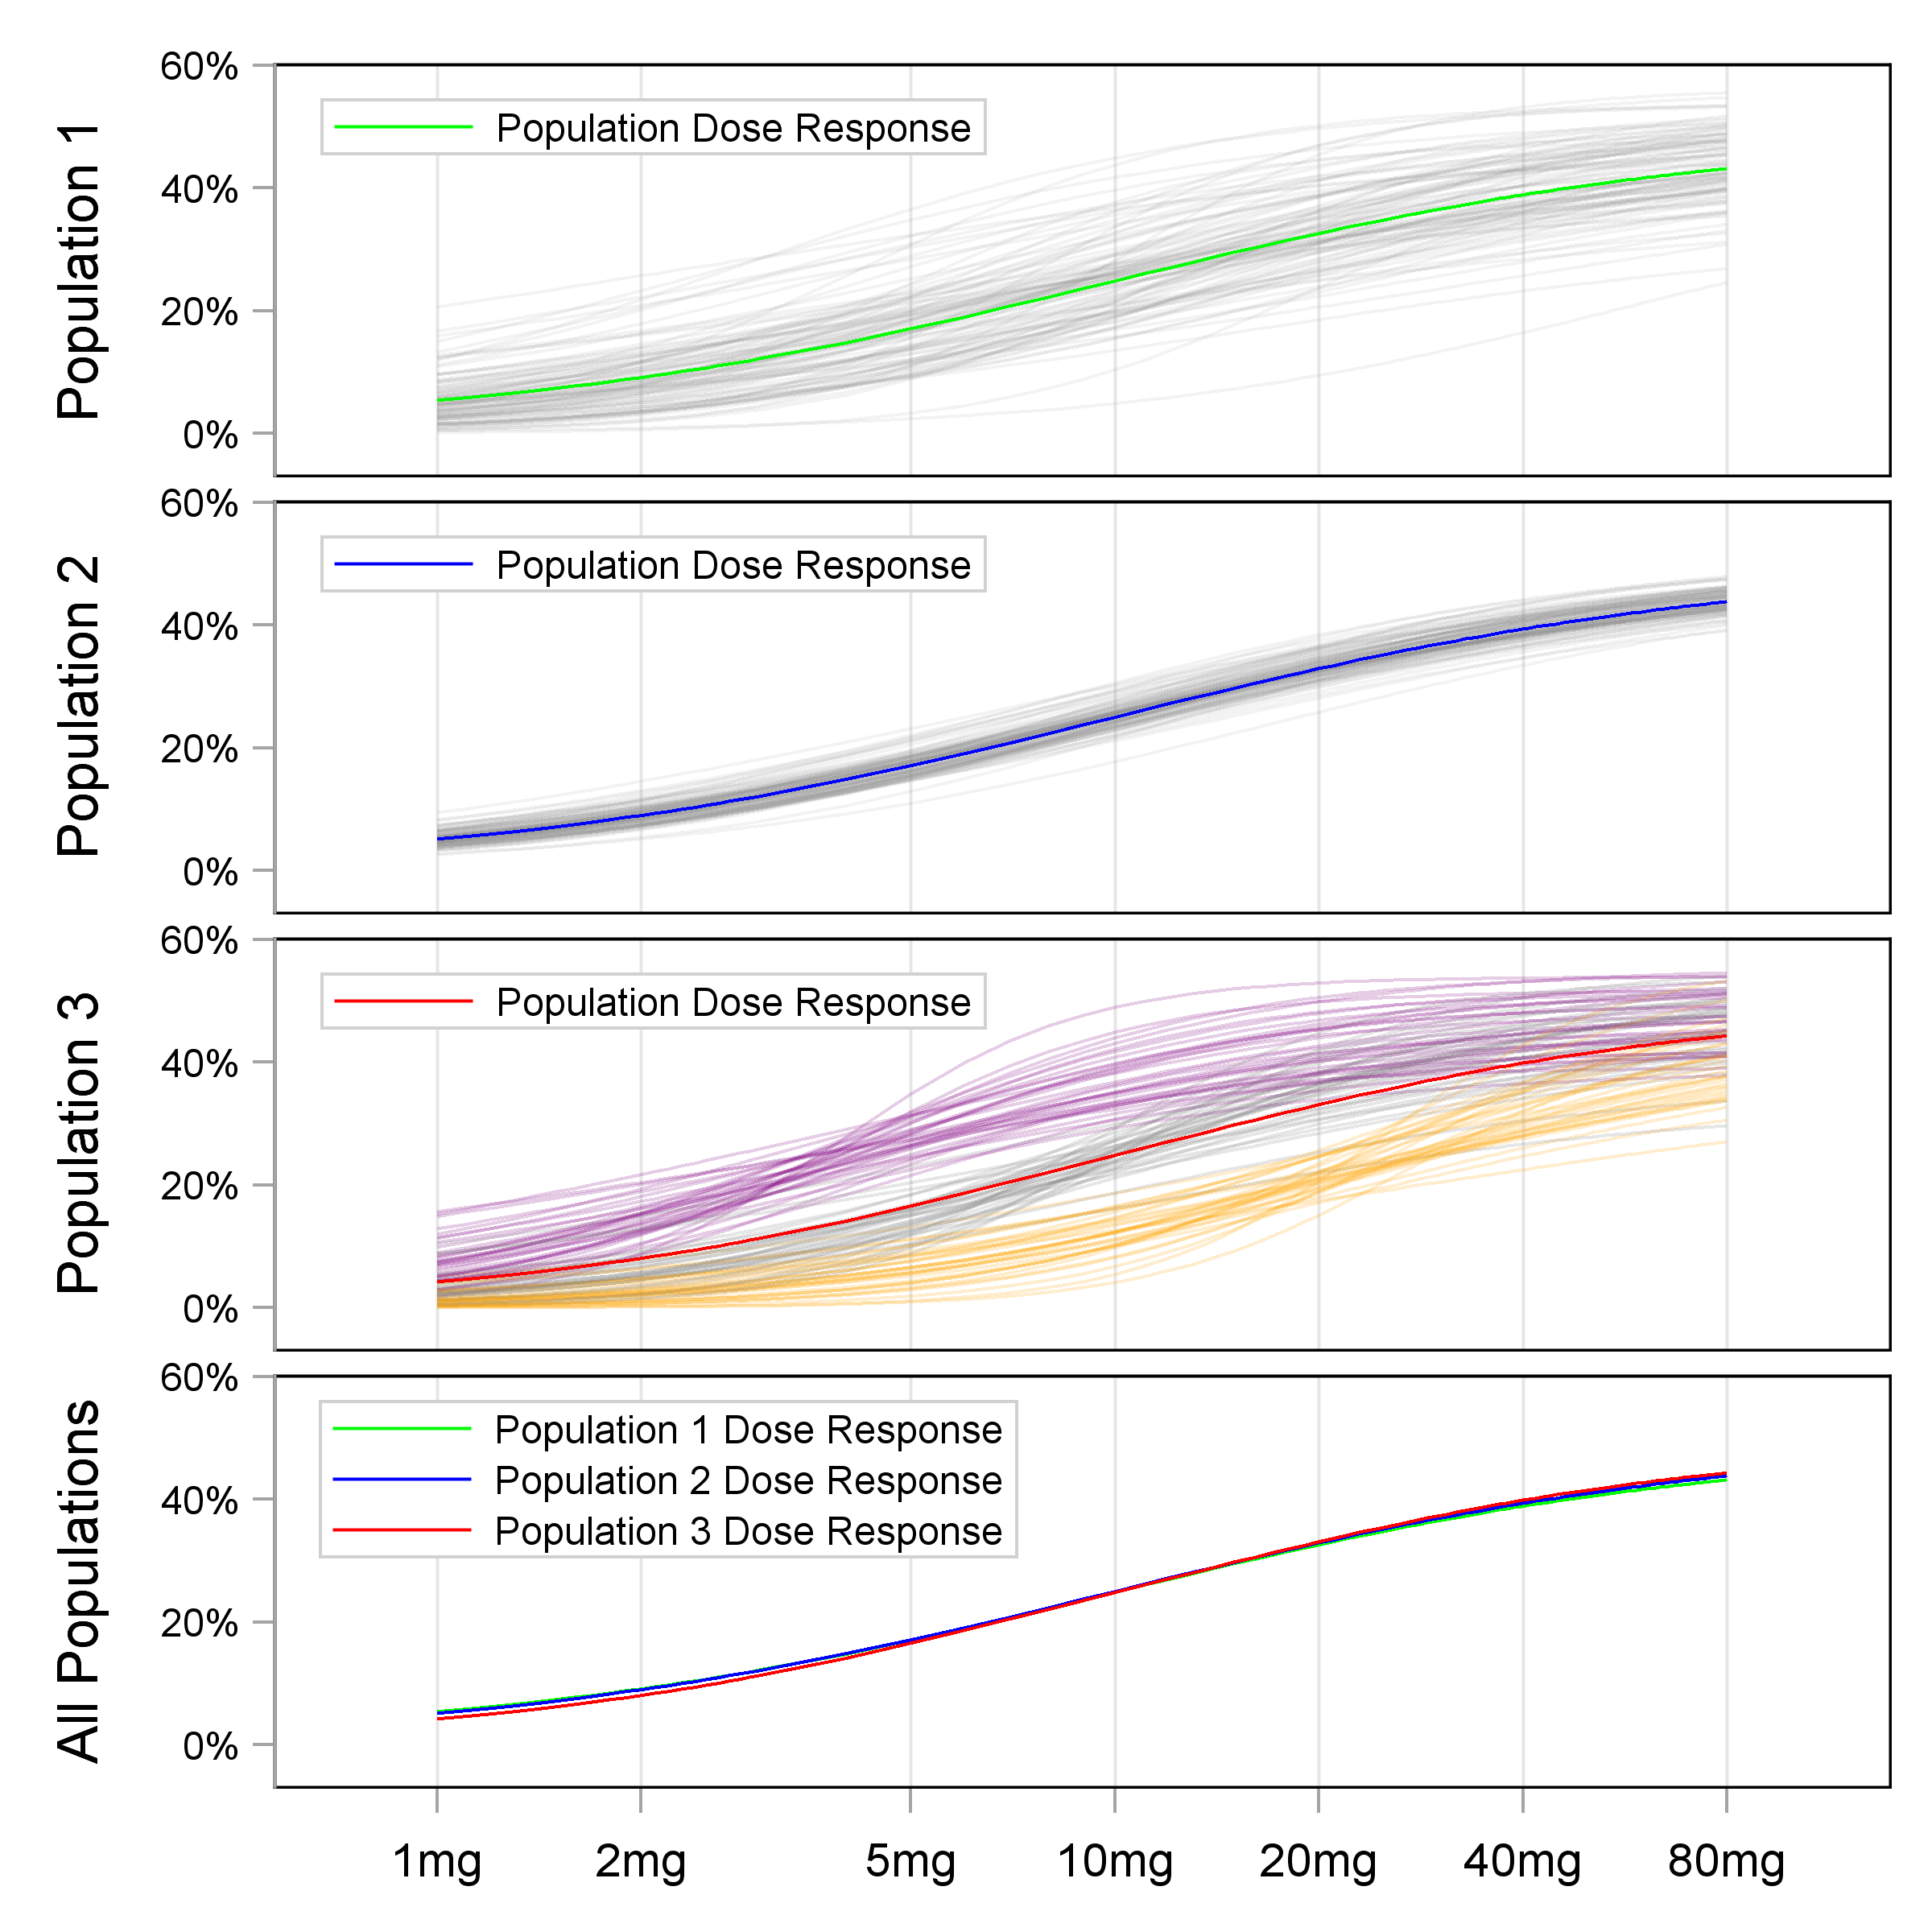
The fact that the Population D-R does not tell us about Individual D-R relationships is demonstrated in Figure 13.2.

In the top 3 panels, the Population D-R under 3 different scenarios are shown alongside 100 random individual D-R curves. The three population D-R curves are shown superimposed in the bottom panel. Thus when we only observe the Population D-R, we cannot infer the shape of the Individual D-R relationships. This highlights the primary deficiency with Population D-R relationships; if we wish to understand Individual D-R relationships, we need different trial designs.
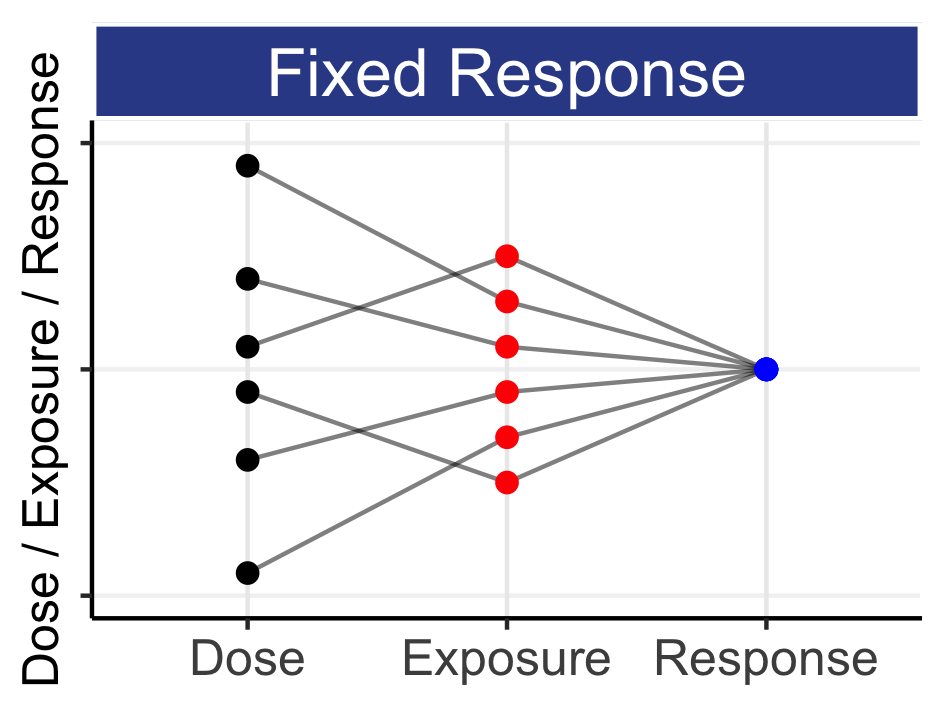
Thus in drug trials where each individual only contributes data from a single fixed dose regimen (or exposure measure), the data generated across individuals/doses can only determine the Population D-R. Most phase 2 “dose-ranging” trials use this crude parallel group design, where different cohorts of individuals receive different doses levels (e.g. placebo and 5 mg, 10 mg, 20 mg, 40 mg and 80 mg); there is no within-individual dose titration. The resulting D-E-R relationships are therefore just Population D-R relationships, and hence any decision on the (optimal) “one-size-fits-all” dose is wholly ignorant to the underlying Individual D-R relationships. Stated alternatively, different Individual D-R relationships can yield the same Population D-R relationships, and hence knowledge of the Population D-R does not provide the required information to enable us to find the right dose for each individual.
In this example, as in real-life, attempting to give the same dose to all individuals (say 10 mg) will result in some individuals being under-dosed, and some individuals being over-dosed. In addition, knowing the Population D-R does not provide any information to help those patients (like Jill Feldman) who wish to adjust their dose to manage horrendous adverse events; the enormous money spent on such development programs and trials are failing here is answer a very predictable question “If I reduce my dose due to severe adverse events, how will this change my future outcomes?” It is perfectly possible that patients who reduce their dose actually outperform those that do not, since the former group may have, on average, higher concentrations and be more sensitive to the drug. Thus, a priori, we cannot simply say any downward adjustment of dose in a (non-random) select group of patients will lead to worse average outcomes compared to those patients who remain on the original dose. Our Population D-R is telling us nothing useful here, as it does not tell us anything about individual patients (and we care about individual patients, right?).
Whether we can or cannot measure the individual D-R relations, we must always acknowledge they exist; patients are heterogeneous, and we must therefore expect to need to change the dose and understand what will happen thereafter.
Quantifying Individual D-E-R relationships requires the response be measured for multiple levels of dose/exposure from a flexible dosing regimen. With suitable designs and analyses, this will allow quantification of IIV in D-E-R. In some cases, we will be able to accurately adjust the dose to achieve a given response. Examples are doses of anaesthetic drugs being continually adjusted to achieve an appropriate degree of anaesthesia, insulin doses being titrated to achieve appropriate glucose control, and warfarin doses being titrated to achieve an international normalised ratio (INR) within an appropriate range. These examples provide us with a template for drug development, both in terms of providing solutions for difficult problems, and on understanding IIV in response. Firstly, there is considerable IIV in the doses required to achieve the target responses across individuals (i.e. 10-50 fold dose ranges). Add references / Show figures? Secondly, it may not always be possible to personalise the dose on the primary responses of interest (e.g. to reduce the risk of micro/macro vascular complications in type 2 diabetes (insulin), or to reduce the risk of serious thrombotic events (warfarin)). Rather, the dose in personalised based on surrogate endpoints/biomarkers known to be correlated with the primary responses (glucose levels in type 2 diabetes, and INR with warfarin). Thirdly, the observed PD responses can take minutes (IV anaesthetic drugs), hours (insulin) or days/weeks (warfarin) before the full cascade from dose to PK to PD are observed, and hence the drug titration strategy needs to simply be structured over a suitable time period based on knowledge of the temporal PK and PD effects. Fundamentally there is no difference whether the appropriate time interval for dose titration is minutes or months/years. Finally, in these examples it is common to adjust the starting dose based on individual patient characteristics. For example, the anaesthetist will start with a different initial dosing regimen for a small child compared to a large adult, followed by subsequent dose titrations. It is worthwhile to consider how these three examples fit the general case shown in Chapter 3 (repeated below).
Given the patients individual characteristics, what is the best drug and initial dosing regimen?
If the initial dosing regimen needs to be changed for efficacy and/or safety/tolerability, how best to do this; what is the best dose titration algorithm? That is, based on clinical endpoints, biomarkers, imaging and/or patient reported outcomes (PRO), when should the dose be changed, and by how much.
Under what circumstances should the dosing regimen be halted? That is, there is no dose for the patient that has a sufficiently positive benefit-risk to justify continued dosing.
These three examples all show IIV leads to a range of different optimal doses across individuals. There is no “one-size-fits-all” optimal dose. Here the endpoints/biomarkers of efficacy/safety are precisely measured, and clearly show IIV and the need for personalised dosing. I would encourage anyone working in a different therapeutic area where drugs may only have 1-2 doses approved (e.g. oncology, epilepsy, depression, RA etc.), to ask themselves “Why would I expect less variation in the optimal doses for my patients with drug X?”. If anything, I think many other indications will have more complex cascades from dose to PK to PD across more heterogeneous patients, thus these examples should serve to highlight the omnipresence of IIV in D-E-R for all drugs/indications, and the crucial need for very wide dose ranges. Although it may be difficult/impossible to measure IIV in D-E-R for some endpoints, we must nevertheless always acknowledge its presence (and hence influence on the optimal dose for each patient). In cases where surrogate endpoints/biomarkers of efficacy are not yet well determined (e.g. Alzheimer’s disease), it may be most reasonably to consider tolerability/safety measures as the primary basis for individualised dose titration.
To complete this section, it is worthwhile to critique two concepts in drug development, that of “the” therapeutic window and “the” maximum tolerated dose (MTD). The definitions on Wikipedia are:
“The therapeutic window… refers to a range of doses which optimize between efficacy and toxicity, achieving the greatest therapeutic benefit without resulting in unacceptable side-effects or toxicity.”
“The maximum tolerated dose (MTD) refers to the highest dose of a radiological or pharmacological treatment that will produce the desired effect without unacceptable toxicity.”
In light of the discussions around Population and Individual D-E-R, it makes little sense to discuss “the” therapeutic window or “the” MTD. Both definitions above are deficient/incomplete. Firstly, the definition of “unacceptable” is inherently imprecise (unacceptable to whom? (the patient, the doctor, the regulator, the pharma company)). Secondly, neither specifically define whether this is a Population therapeutic window or MTD, or an Individual therapeutic window or MTD. For example, warfarin doses of 2-4 mg may keep the INR for one individual within the (therapeutic window) range of 2-3, but a second individual may need 10-15 mg to keep their INR within the same (therapeutic window) range of 2-3. Like there is no “one-size-fits-all” dose for warfarin, there is also no “one-size-fits-all” therapeutic window, or “one-size-fits-all” MTD.
To be precise and meaningful, we must think in terms of the therapeutic window or MTD being unique for each individual, and hence we need to add a subscript “i” for each individual “i” (e.g. MTDi). In Figure 13.1, the “therapeutic windows” would be the doses around the “optimal” doses highlighted for each individual. For 100 individuals, we have 100 therapeutic windows. As a final example, it makes little sense to talk about the therapeutic window or MTD for alcohol. For one individual, the MTDi might be 2 beers, and the MTDi for another individual might be 14 beers. To present “the” (average) MTD as 8 beers is neither helpful nor accurate; it is incorrect for both individuals (…and my MTDi for beer is 5). If we are to personalise dosing for drugs, we are much more interested in determining the distribution of these MTDi’s (i.e. think of a histogram showing the MTDi’s). That is, showing the lowest MTDi’s (individuals who are particularly sensitive to the drug) through to the highest MTDi’s (individuals who are particularly insensitive to the drug).
The Population D-E-R relationships shown in Figure 13.2 are often used (incorrectly) to define “the” therapeutic window (e.g. from 5-20 mg) or “the” MTD (e.g. 20 mg, if the safety endpoint response of 5% at 40 mg is considered “too high”). There are two main problems with this naïve approach. Firstly, the 5% response rate at 40 mg is an accurate response rate if we give 40 mg (without titration) to all individuals. The individual responses at 40 mg (gray lines) are heterogeneous, including individuals across the spectrum from highly sensitive to highly insensitive to the drug; we are determining the rate assuming we must give the same fixed dose to all individuals (i.e. 40 mg). However if the doses were titrated (say from 2 mg => 5 mg => 10 mg => 20 mg => 40 mg) then many (more sensitive) individuals may never reach 40 mg, but rather be adequately treated at lower doses. Hence we should be more interested in the safety response rates at 40 mg only for those individuals who are inadequately treated at 20 mg (the least sensitive individuals). Secondly, if we consider a 5% safety risk as too high, we can see the range of doses where the individual responses (the MTDi’s) cross the 5% threshold. This is shown as a histogram in the Figure xxx below.
Put in figure
Thus the concept of “the” MTD is misguided. In oncology, the use of small 3+3 type trials to determine “the” MTD is still ubiquitous, along with the subsequent use of “the” MTD in pivotal trials. As a result, many patients with cancer are routinely being under and over dosed based on this outdated and scientifically incorrect notion that all patients are identical. Patients are not identical and there is, and always will be, a range of individual MTDs (the MTDi’s). I am puzzled why the concept of “the” MTD has persisted for so long. Any basic review of the tolerability and safety data from oncology trials (e.g. like that for trastuzumab deruxtecan in Section 11.1) clearly shows that “the” MTD is clearly neither tolerable nor safe in a large proportion of patients. “The” MTD does not exist, and the quicker we recognise that, the quicker we can refocus on understanding the MTD for each individual patients (MTDi).
In summary, this chapter has introduced the distinction between Population D-E-R relationships that are simply based on “average” outcomes, and explained why these Population D-E-R relationships cannot tell us about how individual responses will change with dose. Where possible, we should always aim to understand Individual D-E-R relationships, and fully acknowledge that each individual will follow their own D-E-R curve with increasing dose.
